
What Counts as Starting and What Counts as Coming Back in Cohort Retention?
Updated October 2026
Group people by when they started and count each group at its own age. Two choices decide the number.
To see whether people come back, group them by when they started and count each group at its own age. Cohort retention shows what share of each group came back at each age. Looking only at overall totals can hide differences between groups [1], and splitting by cohort brings them out. Two choices make the answer honest: what counts as starting, and what counts as coming back [2][3]. Change either one and the number changes, so say both before you read a single figure. This page defines both, shows how to read the table, and lists the traps.
Also on this topic: the business version, on an online shop and the version for analysts, on students who retake an exam.
The answer first: say what starts and what returns
Group people by when they started. Count each group at its own age. Two choices decide the number: what counts as starting, and what counts as coming back [2] [3]. Say both before you read a figure.
What this means for you
- Say what starts a person's clock, and count each person once. For a store that is usually a first purchase [2] [3].
- Say what counts as coming back, and read one definition at a time. Numbers are comparable only inside one stated definition [2] [3].
- Compare groups at the same age. Read down a column to see whether newer groups do better, and along a row to see one group fade [3].
- Leave unfinished periods empty. A period still in progress is not a period that is over [7].
What a cohort is, and what a start event is
A cohort is a group whose members share a characteristic or an experience within a defined span of time [1]. In retention work the shared thing is the start. Analytics products define a start event as the event that qualifies someone for the analysis [2]. They define a cohort as the people who did the start event on the same date or in the same period [2]. Examples of ours: for a store, the start is usually a first purchase; for an app, it might be a first sign-in.
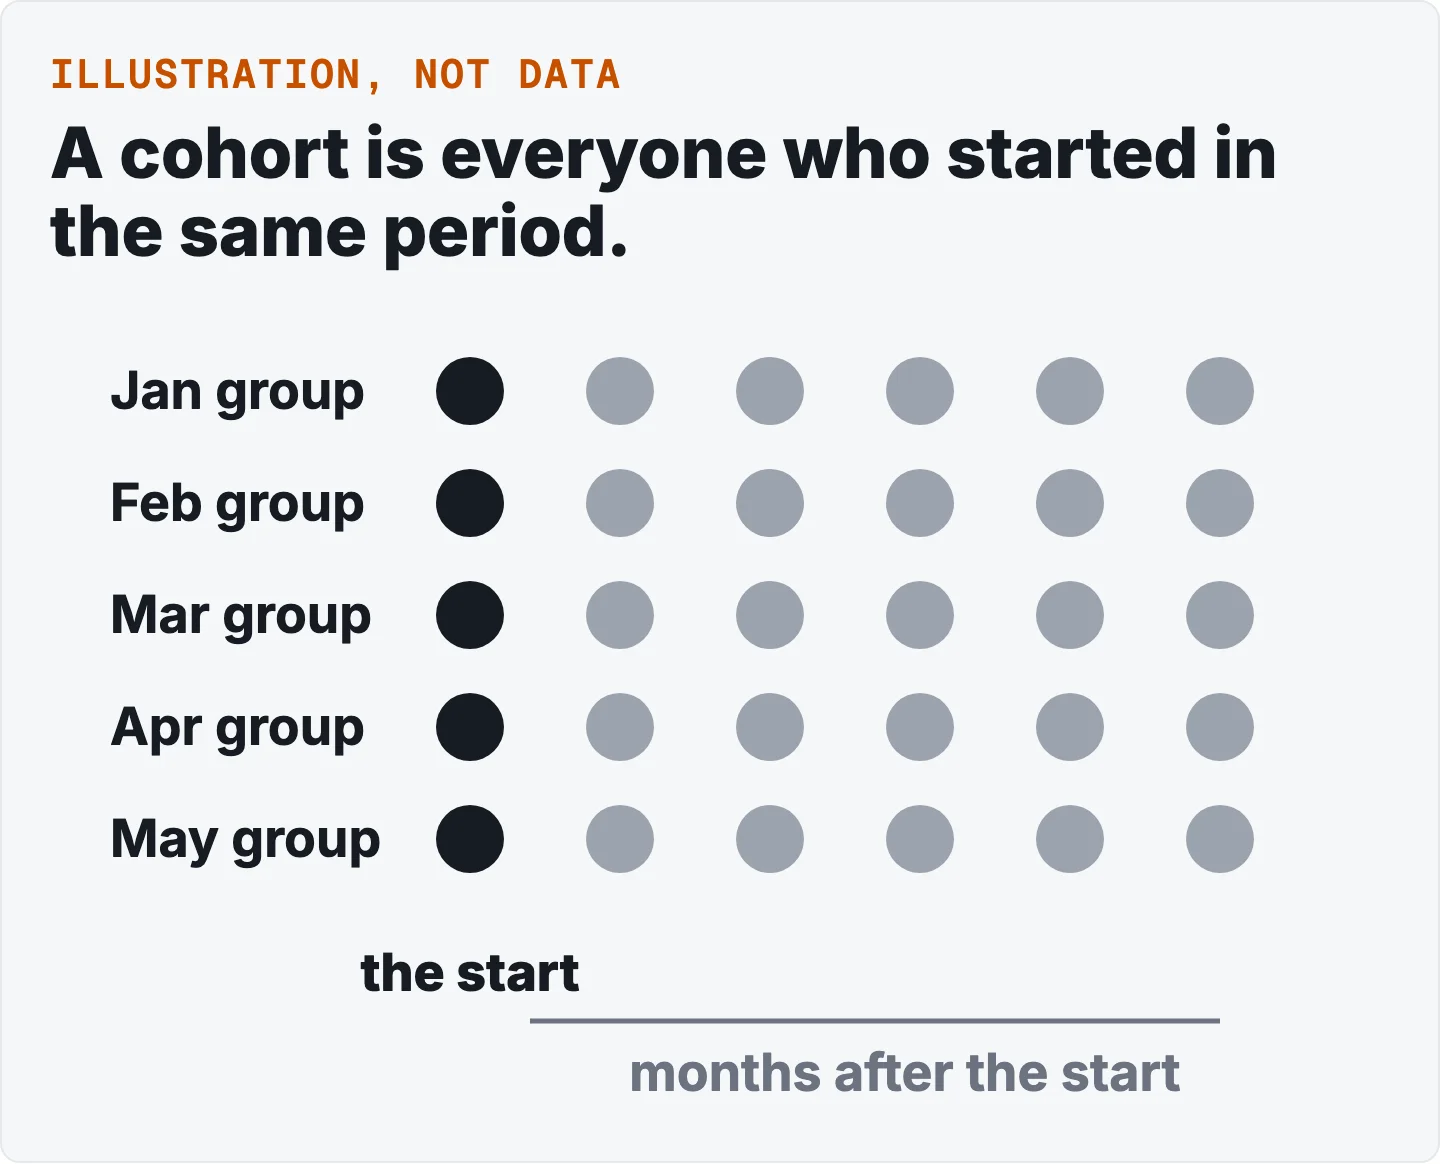
Three rules follow from how these products define it.
- Each person joins once. A person must do the start event once to join a cohort. A duplicate can be excluded so that each person counts only in the period of their first start event [2][3].
- The cohort size is the denominator. The number of people who did the start event in each cohort is fixed. Each later period is a share of that fixed number [3].
- Periods are elapsed time. Age is counted from each person's start, not from the calendar date. In one product's definition, a one-day period needs a full 24 hours to elapse [2]. That is why each cohort is read at its own age: month one after starting, month two, and so on.
Splitting by cohort matters because totals alone can hide differences between groups [1]. Our illustration, not a sourced finding: a line of new customers can look like growth while the ones who came before quietly stop returning.
Exactly in period N vs in period N or later: two meanings of coming back
The second choice is the return event. The thing a person must do again to count as retained. In analytics products it is one or more events that a user must engage with to count as returning [2]. It has to match your question. A visit, a purchase and a reorder are three different return events. They give three different tables.
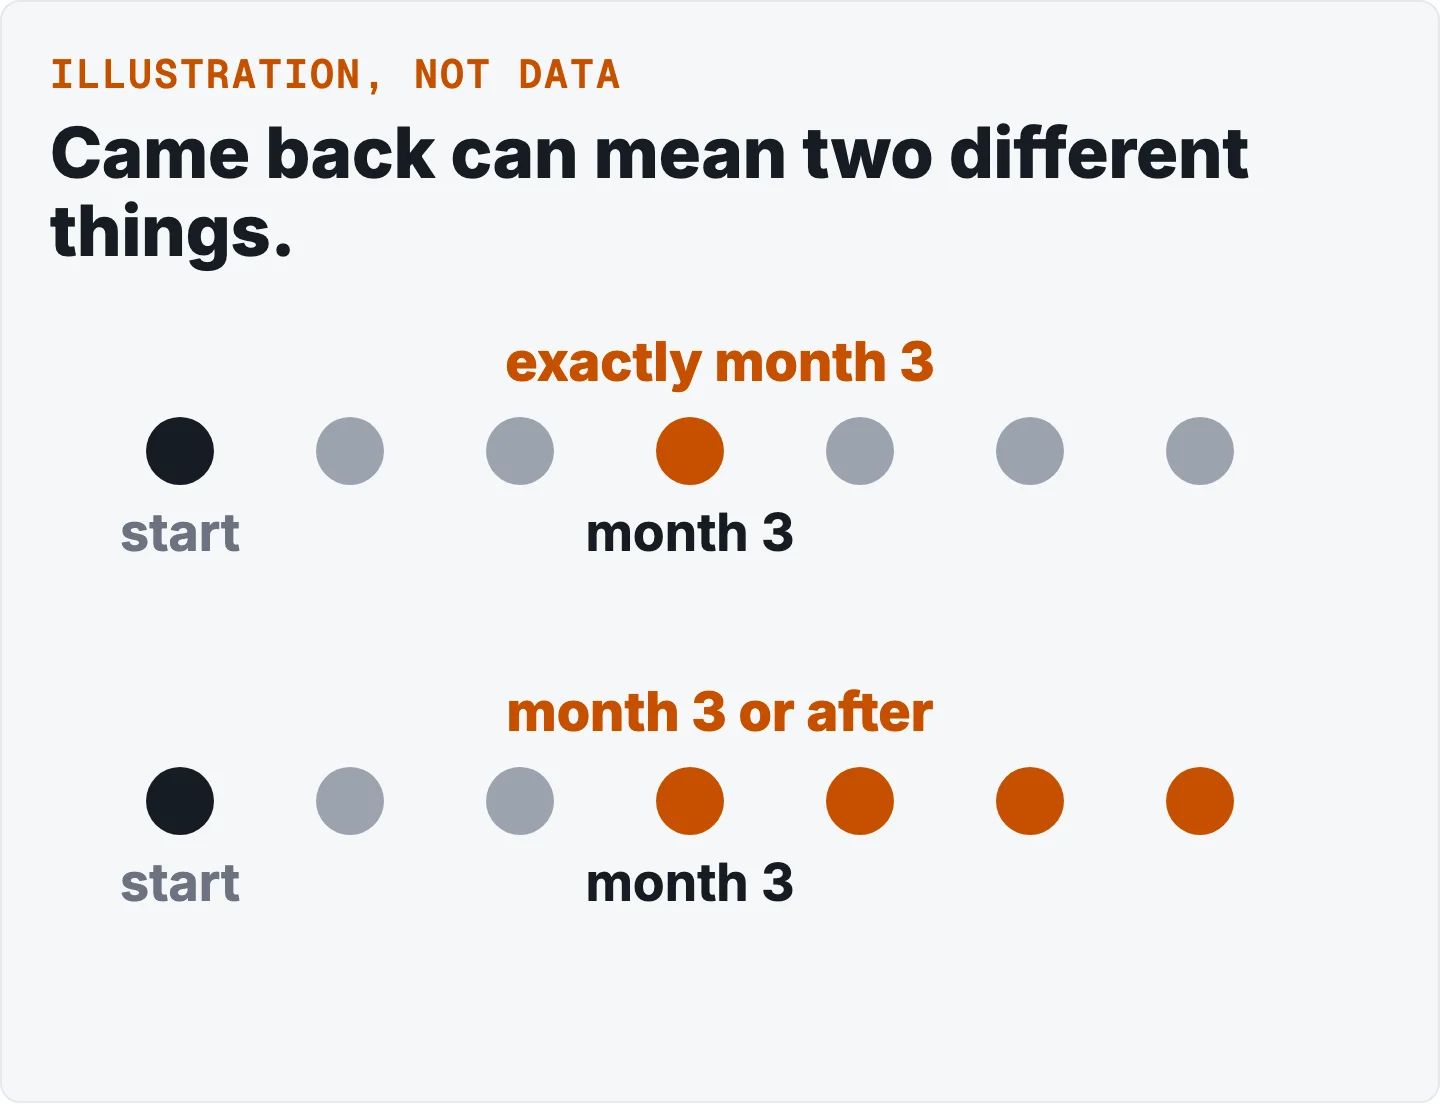
Then comes the timing. Two definitions are in common use [2][3].
| Name | Counts a person as retained when |
|---|---|
| Exactly in period N (bounded, also called N-day). | they return in exactly the stated period. |
| In period N or any later one (unbounded, also called rolling). | they return in that period or any later one, at least once, counted once. |
Read the second one carefully. Counting "in period N or any later one" can only fall as N grows. Someone whose only return is in period four counts at period three, but not at period five. Counting "exactly in period N" has no such rule and can move up and down from one period to the next.
A product's remark that the unbounded measure can rise as the measurement period grows is a different thing [3]. It describes more data arriving for the same cohort, not a larger N. A third definition, "by period N", is cumulative and only rises. These readings of the two definitions are ours.
The practical rule is short: numbers are comparable only inside one stated definition. The same word, "retained", covers both senses across products, and comparing the unbounded column across cohorts with different amounts of follow-up may be unreliable [3].
The free cohort retention tool uses a single-age definition. A customer counts at age N if they bought in the Nth period after the period of their first purchase, one age at a time. The period is a month by default. It measures observed return in purchase data. A returning purchase is not a contract renewal. This page says "came back", not "renewed", for that reason. The sources behind this page describe contractual and event-based products.
Reading the table
A retention table has one row per cohort and one column per age. Rows follow one cohort over its life. Columns compare cohorts at the same age. Darker shading means higher retention [3].
Read it in two directions. Down a column, ask whether newer groups are doing better or worse than older ones at the same age. Along a row, ask how one group fades.
One practitioner rule of thumb, from a single vendor blog and not a tested result. A curve that levels off above zero suggests a stable core of people. One that keeps falling toward zero does not [4]. Treat it as a prompt to look, not as a finding.
Retention and churn are two sides of one question. In one vendor's convention, one minus the unbounded retention rate equals the churn rate [3]. Churn itself can also cover customers who keep receiving service at a reduced level [5], so check which meaning a number uses. For churn on its own, there is a free churn tool.
Why a line can rise
Retention rates sometimes rise over time. The first instinct is that people grew more loyal. Fader and Hardie show a case where that instinct is wrong. In their subscription model, the retention rate is an increasing function of time even though each individual's chance of staying is constant [6]. The rise is due to heterogeneity. The customers with high churn leave early. The ones who remain have lower churn probabilities [6].
They call this the "ruse of heterogeneity" [6]. In one sentence. The customers with high churn leave early, so those who remain have lower churn probabilities, and nobody changed their mind [6]. A crowd leaving a party is our analogy for it. The ones who were never going to stay go first. An aggregate rise does not prove that individuals changed [6].
Traps
A period still in progress is not a period that is over. A customer who started last month has not had the chance to come back in month six. In statistics this is right censoring: a data point is known to be above some value, but not by how much [7]. The Kaplan-Meier estimator handles it by keeping each person in the at-risk count only up to the point they leave observation [8]. For time-to-event data, there is a free survival analysis tool. Our working rule for a table is simpler: leave the unfinished cells empty, and never count them as people who left.
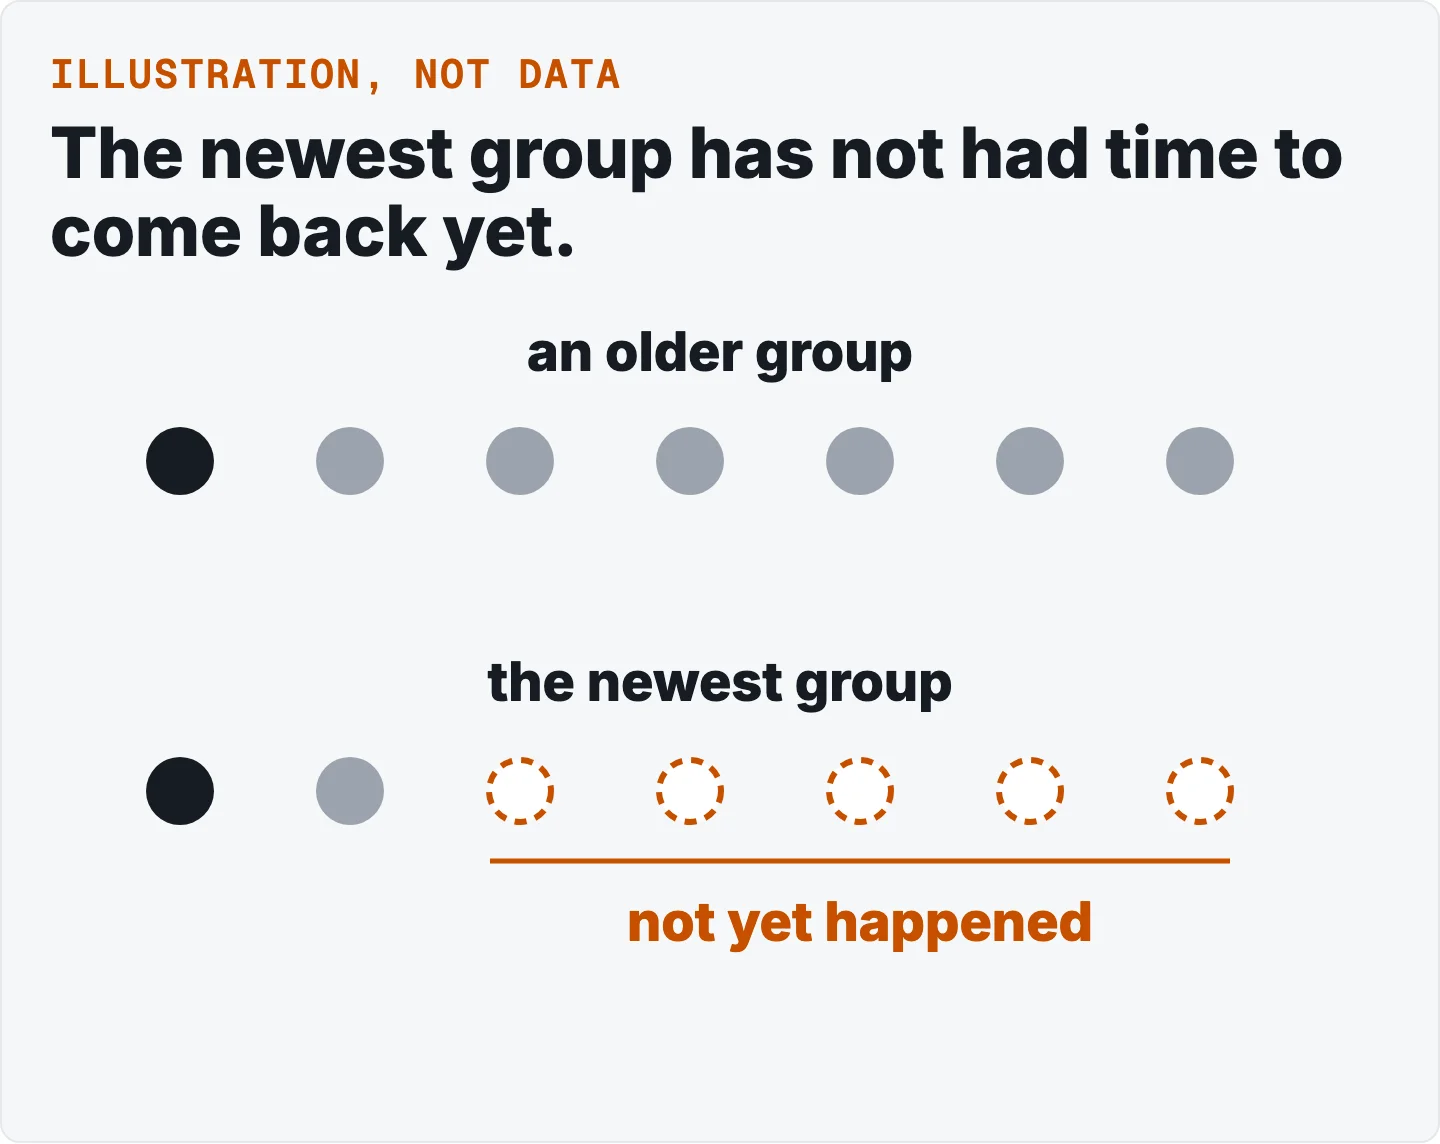
| Cohort | Month 1 | Month 2 | Month 3 |
|---|---|---|---|
| A (oldest). | observed. | observed. | observed. |
| B. | observed. | observed. | not yet happened. |
| C (newest). | observed. | not yet happened. | not yet happened. |
Counting only who is still here. Survivorship bias is the error of concentrating on the entities that passed a selection process and ignoring those that did not [9]. That source does not discuss retention. The application is ours. A retention figure computed only from accounts that are still active leaves out exactly the people whose leaving the figure was meant to show.
Pooling cohorts. In Simpson's paradox, a trend that appears in several groups can disappear or reverse when the groups are combined. It needs very different group sizes and a confounder with a large effect [10]. That source does not discuss retention either. The parallel is ours. One pooled rate across cohorts of different size and mix can say something none of the cohorts says.
How to run one on your own data
- Pick the start event, such as a first purchase. Each person joins once.
- Pick the return event that matches your question, such as a purchase.
- Pick the period and the age. The period is a month by default. Read one age at a time.
- Group people by the period they started in. Count each group at its own age.
- Leave periods that have not finished empty. Do not count them as people who left.
Run the free cohort retention tool on your own purchase file.
What you need and what you get back
What your file needs: one row per purchase, visit or event. It needs a customer ID column and an activity date column. The same customer must have the same ID each time, and blank IDs are left out. A segment column, such as a plan or a region, is optional. Your customers should arrive in at least two different months.
What you get back (these are facts about our tool, not general rules). It shows how many customers were active one, three and twelve months after their first purchase. It uses a single-age definition. A customer counts at age N if they bought in the Nth period after the period of their first purchase. It measures observed return in purchase data. A returning purchase is not a contract renewal. A last month that the data does not fully reach is left out, so its low activity does not read as customers lost.
How we checked it
Three things to know about how this page was written.
Every claim has a source or a label
Each statement is tagged to the numbered reference it came from, or marked as ours. Our own framing is not presented as a sourced rule.
Our tool is described as ours
What the free tool needs and returns is stated as facts about our tool, not as rules from a source.
No numbers from a dataset
This page uses no data, so it gives no typical retention rate. The business and analyst articles show the idea with numbers.
Questions people ask
What is cohort retention?
The share of a group that started together who come back, period by period. The start event and the return event define the group and the count [2].
How is it different from churn?
In one vendor's convention, churn is one minus the unbounded retention rate [3]. Churn can also cover customers who stay but at a reduced level, so confirm which meaning is in use [5].
What is the difference between N-day and unbounded retention?
N-day (bounded) counts a person only if they return in exactly the stated period. Unbounded counts a person if they return in that period or any later one [2][3].
Why does my retention go up in later periods?
Two reasons are described. Early leavers drop out, so those who remain have a lower chance of leaving [6]. And in the unbounded measure, more of the data arrives as the window lengthens, which is our reading of one product's remark [3].
References
- Cohort analysis
- Adobe. Analytics, retention rates. Read October 2026
- Hackle. Retention analysis. Read October 2026
- MetricGate. Retention curves in product analytics. Read as a summary of the page, cited once as a practitioner rule of thumb
- Customer attrition
- Fader, P. S. and Hardie, B. G. S. (2007). How to Project Customer Retention. Journal of Interactive Marketing 21(1), 76-90
- Censoring
- Kaplan-Meier estimator
- Survivorship bias
- Simpson's paradox
- Customer retention